
Table of Contents
Intro
How To Get Synthetics Monitoring To Work In New Relic? – In today’s fast-paced digital scenario, confirming applications’ optimal performance and availability is crucial for businesses. New Relic, a leading observability platform, offers an influential Synthetics feature that permits organizations to monitor their applications, APIs, and infrastructure proactively. This article provides an in-depth, step-by-step guide on how to get synthetic monitoring up and running in New Relic, empowering you to gain valuable insights into your system’s health and routine. Thus, New Relic’s Synthetics Monitoring is a powerful tool designed to keep your applications running smoothly by providing proactive insights into their performance.
What Is Synthetic Monitoring?
Synthetic monitoring is an approach for monitoring the performance, availability, and functionality of web applications, websites, and APIs by simulating the paths that connect users to the service. Synthetic monitoring provides insight into the application’s performance, user experience, and API functionality. Besides, it also predicts any upcoming issues that may affect your application or website’s performance. It’s neither magic nor mystery! It’s a modern ML and AI combination to help you manage your web applications.
How Does Synthetic Monitoring Benefit Global Business?
Global businesses use synthetic monitoring to ensure the optimal performance of their digital services. Let’s discuss its valuable effects.
- Predictive nature: A synthetic monitoring system can analyze operational data to forecast the future performance of your application or website. You examine a few analytics to predict potential issues your application may encounter.
- Business Agility: Synthetic monitoring allows you to deploy applications at your business’s pace while considering the market scenario. The infrastructure will be adaptable to changing seasons.
- Global performance monitoring: Global companies can test their apps’ performance and availability from multiple locations to provide a consistent user experience.
- Regulatory compliance: Regional data privacy may affect application performance and availability. Companies can comply with these regulations and improve user experience with synthetic monitoring.
- Complex Application Monitoring: Synthetic monitoring simulates user interactions and processes in many complex applications. Besides, it imitates complex actions like browsing databases, testing API performance, testing how things work together, etc.
- Performance optimization: Synthetic monitoring finds bottlenecks, slow-loading elements, and problematic third-party integrations. Similarly, this data helps businesses optimize their apps and boost performance, improving user experience and sales.
- Benchmarking and SLA monitoring: Businesses can set performance benchmarks for third-party services or APIs and monitor compliance with Service Level Agreements (SLAs) using synthetic monitoring.
The New Relic Synthetic Monitoring
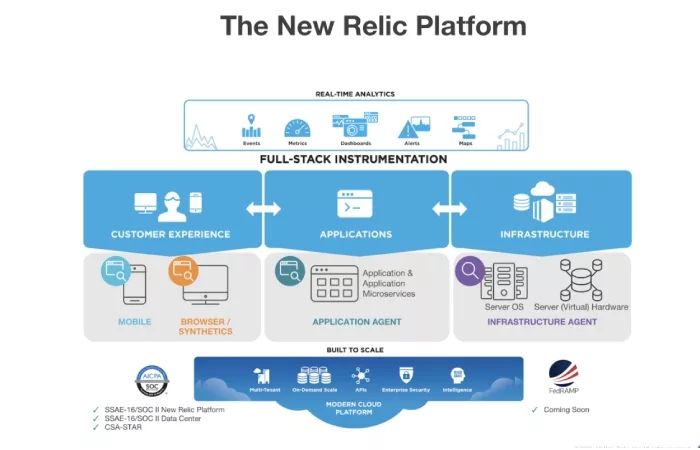
New Relic Synthetic Monitoring is a tool that simulates user interactions with websites and apps. It proactively monitors your website’s performance, alerting you to errors, failures, or anomalies that could impact user experience. It’s like your virtual detective, always looking for trouble in your websites and applications. It’s a clever tool that creates ‘synthetic’ users to test your site and highlight any problems before they affect your users.
This tool provides global insights. It optimizes your app for every user, whether using a mobile in Miami or a desktop in Dubai. So breathe deep, relax, and let New Relic Synthetic Monitoring run your digital world 24/7.
New Relic primarily offers seven different types of monitoring,
- Availability (Ping)
- SSL Certificate Expiration (Certificate Check)
- Page Link Crawler (Broken Links Monitor)
- Page Load Performance (Simple Browser)
- User Flow/Functionality (Scripted Browser)
- Endpoint Availability (Scripted API)
- User Step Execution ( Step Monitor)
How To Get Started with Synthetics Monitoring To Work in New Relic: Setup Page Load Performance For Monitoring
You can use this simple browser monitor to check the accessibility and performance of a single page and monitor the page’s overall load. Moreover, how to get synthetics monitoring to work in new relic by following this steps;
Step 1: Pick Your Synthetic Monitor
- You can bounce to the fourth step if you’ve set up an availability monitor. If not, let’s get through.
- After you sign up, you’ll be taken to the New Relic dashboard. It shows all of the available options.
- Find and select the Synthetic Monitor on the left side of the dashboard. It will lead you to the Create your first monitor option.
- Navigation route: one.newrelic.com > Synthetic monitoring > Create your first monitor
Step 2: Set up Your Page Load Performance Monitor
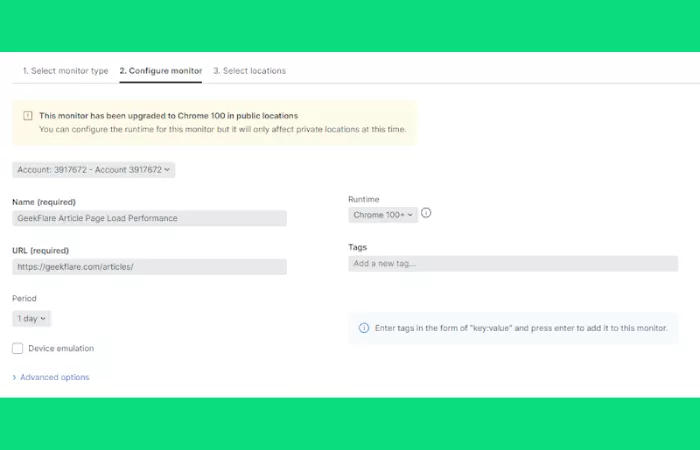
Name your monitor and enter the website’s URL in the Configure Monitor window. We’ll check our website using the Geekflare Article page URL. Set the duration of the monitoring at the bottom.
Step 3: Select the Location for the Page Load Performance Monitor
- Select the locations where you want to check the page load performance. There are 20 major cities from 6 different continents to choose from.
- Let’s pick four different locations from the four major continents: Washington (North America), Milan (Europe), Singapore (Asia), and Sydney (Australia).
Step 4: Check Page Load Performance Test Results
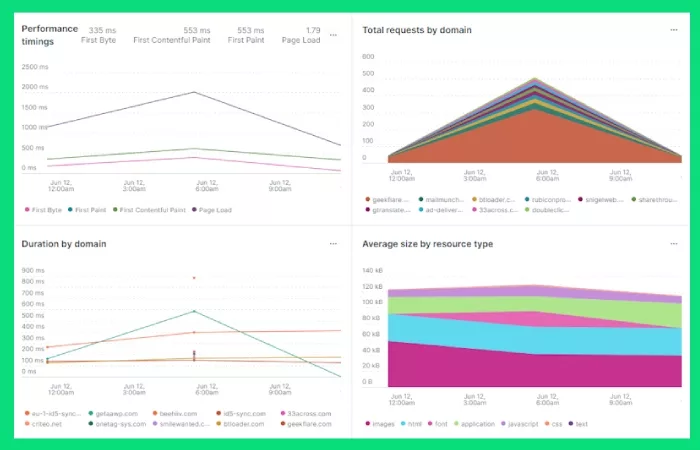
- At the top of the dashboard, you’ll find a summary of the monitoring. It will display the statistics, failed tests, and success rates.
- The complete set of results is presented at the bottom in 5 lovely graphs, one for each: Performance timing, Domain requests, Duration, Average size resource types, and Error response codes.
- To view the complete result, click the Result button to the right of the Summary button. Here, you can look up the details of loading times for different places.
- Look at the first few results. Clearly states that the users from Sydney need help loading our article page.
- The longest one took 3.28 seconds. So let’s have a look deep into the result. Yes, you can even dive deeper! And to do that, click on that specific result.
- Now, you can find the time every component of that page took to load, including the Application, CSS, HTML, Images, JS, and Text. Also, it shows you the total data transferred and the number of requests needed to complete the page load.
- Scroll down to see all the details of that page, such as the loading time of each image and code. Click on any of the components—for instance, the top HTML component.
- You can see every component detail, including size, transferred size, status, server IP, connection ID used, HTTP version, request time, and more!
Using the Page Load Performance monitor, you can identify and resolve any issues slowing down your website.
Conclusion:
Hence, this article shows a detailed guide for how to get synthetics monitoring to work in new relic. Synthetics monitoring in New Relic empowers organizations to manage their application performance and user experience proactively. By following this inclusive guide, you can navigate the setup process seamlessly, ensuring that your monitors provide valuable insights into your system’s health. As technology evolves, leveraging tools like New Relic Synthetics becomes increasingly essential for staying ahead in the digital landscape.
FAQ’s
Q: What is synthetic monitoring in New Relic?
A: Synthetic monitoring in New Relic is a feature that allows you to simulate user interactions to monitor the accessibility and performance of your applications from various locations.
Q: What are the different types of monitors available in New Relic?
A: New Relic offers four types of monitors – Ping, Simple Browser, Scripted Browser, and API Test – each designed for specific monitoring needs.
Q: How do I set up a Ping monitor in New Relic?
A: To set up a Ping monitor, provide the URL or IP address to ping for availability, configure alert thresholds, and select monitor locations.
Q: Can I simulate user interactions with Scripted Browser monitors?
A: Scripted Browser monitors allow you to create complex scripts in JavaScript to simulate user interactions like page navigation and form submissions.
Q: How often can I schedule a monitor to run in New Relic?
A: You can schedule monitors to run at various intervals, including every 5 minutes, once an hour, or with a custom frequency.
Q: Can I integrate synthetic monitoring data with other New Relic features?
A: You can integrate synthetic monitoring data with New Relic dashboards and insights to comprehensively view your application’s performance.
Q: How does New Relic alerting work for synthetic monitors?
A: You can set up alerting policies based on monitor results to receive notifications through various channels when specific thresholds are breached.
Q: Can I monitor APIs and validate responses using API Test monitors in New Relic?
A: Yes, API Test monitors allow you to monitor API endpoints and validate responses based on specific criteria, such as status codes and response times.